We compared virtual servers from six leading Czech providers with our new generation of VPS. The result? A higher price doesn’t guarantee better performance or quality.
In August of this year, we launched a new virtualization based on Proxmox VE platform, powered by the latest AMD EPYC Milan processors and NVMe SSD storage. According to our internal benchmarks, the new generation is 300% more powerful and delivers 2.5× faster write speeds compared to the previous KVM-based platform. Our customers, who were migrated free of charge to this new infrastructure without any price increase, have already noticed the difference. But how does this new virtualization perform when compared to the leading VPS providers in the Czech Republic?
Key takeaways:
- A higher VPS price doesn’t guarantee better performance or speed
- The providers with cheaper VPS outperformed a cloud operator
- NVMe SSD storage doesn’t always ensure lightning-fast performance
- Our new generation of VPS ranked among the top performers in testing
Selection of Providers and Testing Methodology
To ensure an objective and independent comparison of VPS performance and speed, we took inspiration from a study conducted by ZonerCloud in March of this year. In that study, the provider tested CPU, memory, and storage performance across seven hosting companies, including our previous VPS Windows Start model, which at the time still ran on the former virtualization platform.
For our new comparison, we included the same providers as in the original study but made several adjustments. To increase objectivity, we replaced some of the basic Windows VPS models with more powerful (standard-tier) configurations, where available. We also tested our new virtualization environment based on Proxmox VE.
| Parametr | Coolhousing | Forpsi | Hukot | Microsoft | Vultr | Webglobe | ZonerCloud |
|---|---|---|---|---|---|---|---|
| Service/Model | CMX WIN SSD Standard | Classic VPS Basic | VPS-W04G | Standard-B2S | vc2-2c-4gb | Webglobe VPS Windows | Cloud Server Windows Individual |
| Monthly price (excl. VAT) | 585 Kč (293 Kč) |
689 Kč | 160 Kč | 42 USD | 52 USD | 1 379 Kč | 629 Kč (315 Kč) |
| Virtualization | Proxmox VE | KVM | KVM | Hyper-V | KVM | KVM | Hyper-V |
| Windows server | 2022 | 2022 | 2022 | 2022 | 2022 | 2022 | 2022 |
| CPU | 2 cores | 2 cores | 2 cores | 2 cores | 2 cores | 2 cores | 2 cores |
| RAM | 5 GB | 4 GB | 4 GB | 4 GB | 4 GB | 5 GB | 5 GB |
| SSD | 50 GB | 40 GB | 40 GB | 128 GB | 80 GB | 50 GB | 50 GB |
| VPS activation time | 60 s | 18 min | 12 min | 2 min 45 s | 75 s | 30 s | 1 den |
| 24/7 support | Yes | No | Yes | No | No | Yes | Yes |
| Location | CR (Brno) | CR (Ktiš) | CR (Česká Třebová) | Germany (Frankfurt) | Germany (Frankfurt) | CR (Unspecified) | CR (Brno) |
Parameters and pricing were taken from public price lists and configurators available at the time of measurement — September 2025. Prices shown in parentheses represent temporary promotional or discounted rates, valid under specific conditions set by each provider (such as introductory discounts, first billing period, or prepayment for three months or one year).
For our measurements, we replicated the ZonerCloud methodology and used the same independent benchmarking tool: Phoronix Test Suite, in its latest version 10.8.5. This well-known and widely respected software within the IT community includes over 100 tests for evaluating various aspects such as CPU, GPU, memory, cryptography, bioinformatics, and machine learning performance.
For the purpose of our comparison, we selected five specific tests listed below. These benchmarks capture detailed performance differences between the tested VPS servers and provide a comprehensive view of their hardware capabilities, real-world speed, and overall performance.
| Test type | What it measures? |
|---|---|
|
7 Zip Compression |
Measures CPU performance during file compression using 7-Zip. The result is expressed in MIPS (Million Instructions Per Second), the higher the value, the faster tasks such as zipping, backups, or other operations involving many small files will run. This benchmark effectively reflects the combined CPU and memory subsystem performance under real operation. |
|
OpenSSL |
The OpenSSL benchmark determines how fast the CPU can encrypt and decrypt data using the OpenSSL library. It evaluates the processing power and responsiveness of the server when handling secure communications. A higher result indicates smoother and faster operation with minimal latency. |
|
CacheBench |
CacheBench measures the throughput of the memory subsystem, how quickly the CPU can read and write data through its cache layers (L1/L2/L3) and pass information to system memory with varying block sizes. The outcome is expressed in MB/s, and higher values mean better CPU-to-RAM performance. |
|
Diskspd |
The Diskspd test evaluates the speed and latency of the storage subsystem. It measures how quickly the disk processes large files and how efficiently it handles multiple small requests simultaneously. Results in MB/s reflect copy and load speeds, while IOPS indicate the number of completed input/output operations per second. In both cases, higher values mean better performance. |
|
SQLite |
The SQLite benchmark executes a series of small database operations (typically INSERT/UPDATE/SELECT) and measures the actual execution time. The result depends on fsync latency, journaling mode, and storage performance. The unit is seconds, and the lower the time, the faster the database and application response. |
| Test type | What it measures? |
|---|---|
|
7 Zip Compression/p> |
Measures CPU performance during file compression using 7-Zip. The result is expressed in MIPS (Million Instructions Per Second), the higher the value, the faster tasks such as zipping, backups, or other operations involving many small files will run. This benchmark effectively reflects the combined CPU and memory subsystem performance under real operation. |
|
OpenSSL |
The OpenSSL benchmark determines how fast the CPU can encrypt and decrypt data using the OpenSSL library. It evaluates the processing power and responsiveness of the server when handling secure communications. A higher result indicates smoother and faster operation with minimal latency. |
|
CacheBench |
CacheBench measures the throughput of the memory subsystem — how quickly the CPU can read and write data through its cache layers (L1/L2/L3) and pass information to system memory with varying block sizes. The outcome is expressed in MB/s, and higher values mean better CPU-to-RAM performance. |
|
Diskspd |
The Diskspd test evaluates the speed and latency of the storage subsystem. It measures how quickly the disk processes large files and how efficiently it handles multiple small requests simultaneously. Results in MB/s reflect copy and load speeds, while IOPS indicate the number of completed input/output operations per second. In both cases, higher values mean better performance. |
|
SQLite |
The SQLite benchmark executes a series of small database operations (typically INSERT/UPDATE/SELECT) and measures the actual execution time. The result depends on fsync latency, journaling mode, and storage performance. The unit is seconds, and the lower the time, the faster the database and application response. |
All testing was conducted in a Windows Server 2022 environment with a strong emphasis on result reproducibility. To ensure maximum objectivity, each benchmark was executed four times at different times and on different days throughout September 2025, minimizing the impact of potential operational fluctuations. The final value for each VPS model therefore represents the average of all four measurements.
Test Results
1) 7 Zip Compression (CPU Performance)
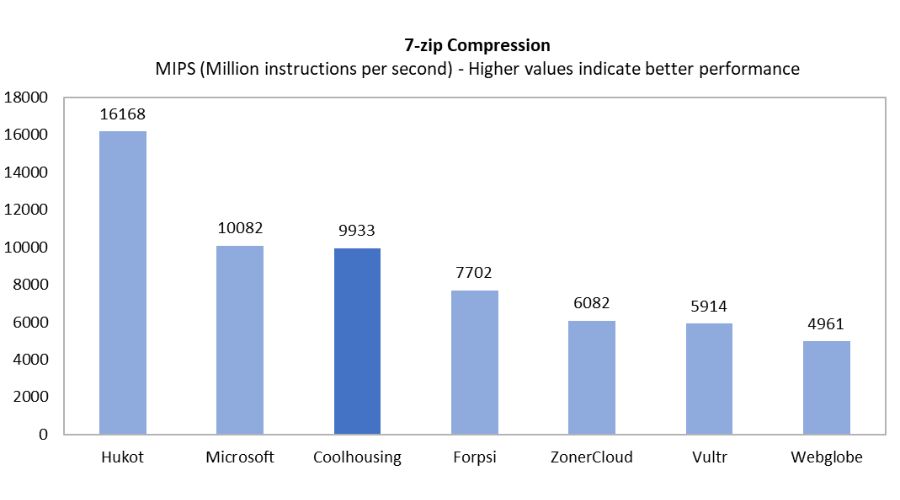
In the CPU performance test measuring compression speed using 7-Zip, the clear winner was the virtual server from Hukot, achieving a significant lead over all competitors. Our VPS Windows Standard ranked second, followed closely by the Microsoft cloud server, both showing nearly identical results. The remaining providers scored considerably lower, with performance values roughly an order of magnitude below the top results.
An interesting finding is that the virtual servers from Hukot and Coolhousing are among the most affordable models of all tested VPS providers.
2) OpenSSL Test (CPU Performance)
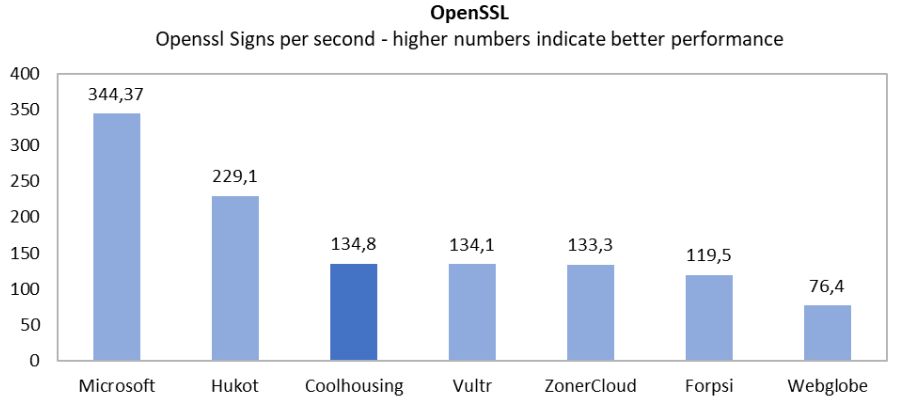
From the perspective of smoothness, CPU performance, and encryption speed, the top three positions were occupied by the same providers as in the previous test, though the first two swapped places. The winner of this benchmark was the Microsoft cloud server, achieving an average of 344.37 SSL operations per second. Second place went to Hukot’s VPS server, while our Windows VPS ranked third.
However, the performance gap between the top two and the rest of the field was significant. One possible explanation lies in CPU instruction set optimizations tailored for this specific type of workload, which could easily account for such a large difference between first and second place.
3) CacheBench (CPU-to-RAM Throughput)
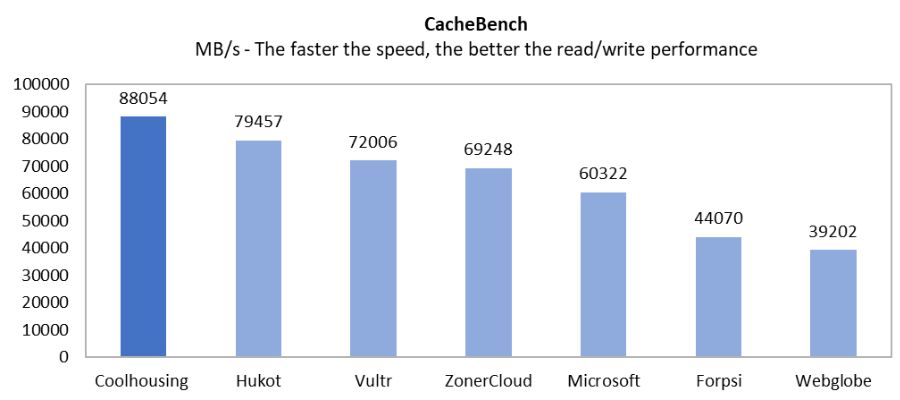
In terms of throughput and data read/write speed, our VPS hosting ranked first, achieving nearly 88 GB/s. The second-best throughput was recorded by Hukot’s VPS-W04G, while the Vultr cloud provider took third place with a measured throughput of 72 GB/s.
4) DiskSpd (Storage Subsystem Performance)
To compare storage speed and performance among the selected providers, the DiskSpd test was run using two different configurations, varying in read/write ratio, file size, and I/O block size:
- A) 2 threads, 40% write request, 1 GB File size, 32 KB block size
- B) 2 threads, 100% write request, 2 GB File size, 8 MB block size
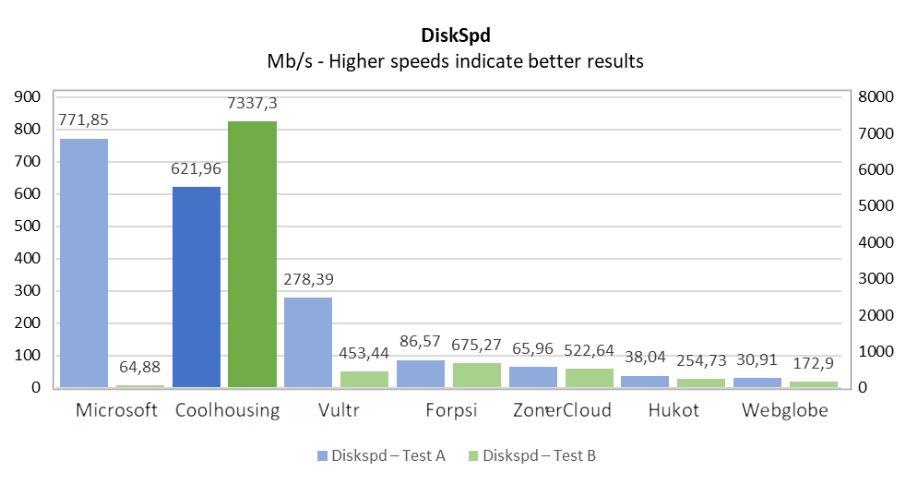
Based on the measured values, the winner of Test A is the cloud server from Microsoft with a result of 771.85 MB/s (23,554.88 IOPS), however, within Test B at 64.88 Mbps, it was conversely the weakest of all tested servers. Our tested model achieved an average value in Test A of 621.96 MB/s (19,902.89 IOPS), and 7,337 MB/s in Test B, where it became the clear winner. Third place is occupied by providers Vultr and Forpsi. In Test A, we measured Vultr at an average of 278 MB/s (8,908 IOPS) and 453.44 MB/s in Test B. Forpsi had weaker Test A performance than Vultr with a speed of 86.57 MB/s (2,770.26 IOPS), while in Test B it achieved the second-highest value: 675 MB/s.
5) SQLite (Operation Speed – Database read and write)
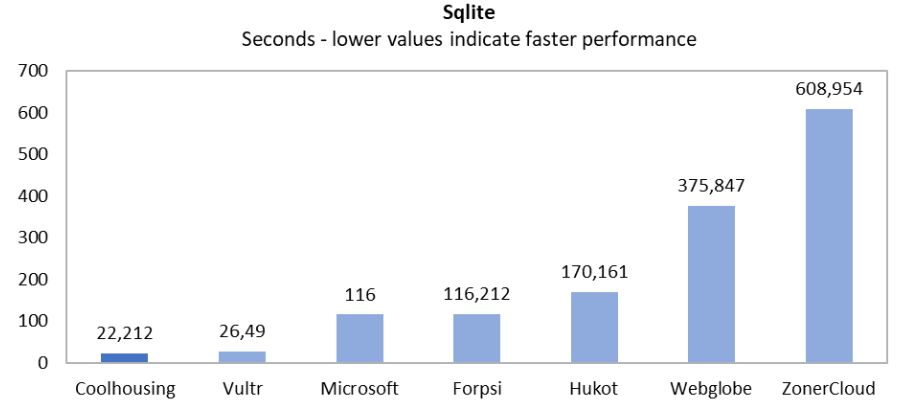
When comparing all seven servers, our data center’s VPS Windows Standard with NVMe SSD responded fastest with an excellent result of 22 seconds. Hot on its heels, Vultr’s cloud server came in second with a measured time of 26.5 seconds. Third place went to Microsoft, another pure cloud solution provider, though with a considerably larger performance gap.
Insights from Testing
The tests conducted on seven leading providers in the Czech Republic using the independent Phoronix Test Suite tool reveal several findings.
Regarding CPU performance, throughput between CPU and RAM, as well as storage speed, higher price is not a guarantee of better performance. In fact, the providers with the lowest prices, Coolhousing and Hukot, placed at the top in the overwhelming majority of tests.
All participating hosting companies, except Webglobe, offer virtualization on fast NVMe SSD drives. However, the measured throughput values and read/write speeds vary significantly across individual providers. This shows that simply deploying NVMe SSDs does not automatically guarantee top-tier performance when working with data.
Data from testing our new virtualization platform compared to other providers confirmed that the new generation of VPS hosting is more than competitive. Dedicated clusters for exclusive operation of VPS Linux and VPS Windows, server-grade NVMe SSD U.2, and the Proxmox platform demonstrate excellent performance. And we are just getting started with our virtualization infrastructure.
The Future and GPU VPS
Launching new virtual servers represents the first step in our data center’s plans. Thanks to the high scalability of our new virtualization infrastructure, we plan to add AMD EPYC ZEN 3 generation processors by the even more modern ZEN 4 generation in the coming months, specifically the Genoa series. Simultaneously, with growing interest in machine learning, we intend to expand virtualization with additional clusters, this time optimized for operation with GPU cards.
Try one of the most modern virtual servers operated in the Czech Republic from Coolhousing data center with very interesting price. In addition to a 14-day trial period, the VPS price includes quality connectivity at speeds up to 1 Gbps with no limit, effective Anti-DDoS protection, and the ability to back up data up to 7 days back in the form of Snapshots. Such a combination of performance, specifications, and benefits is hard to find on the market.

